Data to track outcomes for Tennessee children birth through third grade

The first eight years of a child’s life are so defining that third grade reading and math outcomes predict future academic, career and life success. That’s why we created the Bright Start Tennessee Network (Bright Start TN) – an initiative of TQEE that brings together a statewide network of community partnerships dedicated to accelerating early learning outcomes and closing achievement and opportunity gaps for Tennessee children birth through third grade.
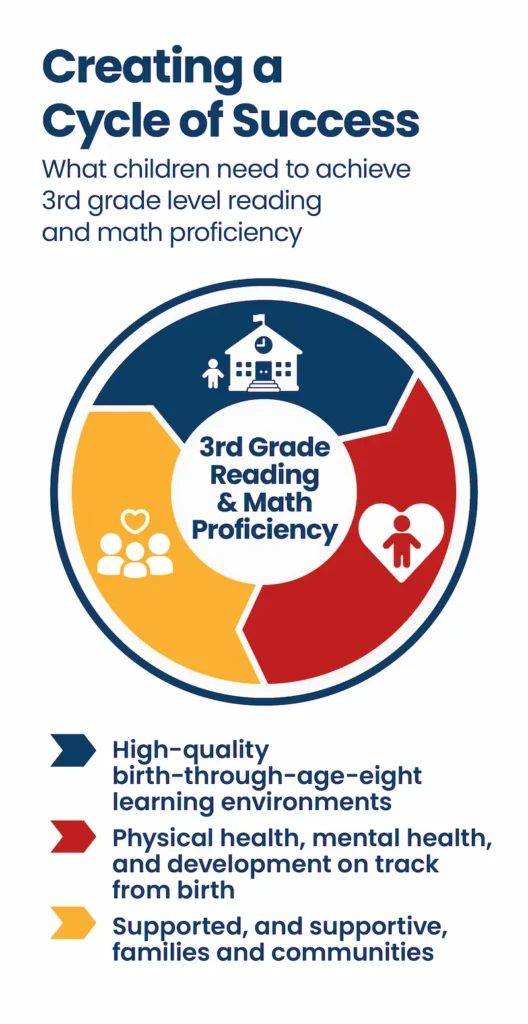
Decades of research show what children need to build strong brains and succeed in school: 1) high-quality birth-through-age-eight learning environments, 2) health and development on track from birth, and 3) supportive and supported families and communities. The image at the right depicts the Bright Start TN ultimate goal of reading and math proficiency by third grade (see the visualizations at the bottom of this page) and the three supporting domains that guide the Bright Start TN measures of success. These 15 measures of success serve as metrics for ensuring quality early development, and when implemented well, positively impact third grade outcomes.
The Bright Start TN Data Dashboard provides data related to the major indicators for each of the 15 Bright Start TN measures of success. It aims to be a public resource of state and community-level data that will help track trends, identify areas of need and make informed decisions that support children and influence direct services and policy change.
You can read more about the Bright Start TN measures of success in the Bright Start TN Clearinghouse, and the data corresponding to each measure can be explored by clicking on the tabs below.
Browse by measure of success below:
High-Quality Early Learning
Health & Development
Family & Community
The ultimate indicators* for the Bright Start TN work are the percent of 3rd grade children proficient in reading and math.
This first data set is aggregated Bright Start TN Region and the second set is disaggregated by school district. Further subgroup disaggregation can be found by selecting the dropdown menu on the right and selecting a subgroup (race/ethnicity + students with disabilities + English learners + economically disadvantaged, etc)
Instructions:
- Click on any Bright Start TN Region to isolate the data to the school districts in the specific Bright Start TN region.
- Choose between reading (ELA – English Language Arts) and math.
- Data can also be sorted by name of school district.
- Click on any school district in the second map to see all demographic breakdowns for a school system.
- The bold vertical line represents proficiency. The percentages to the right of the line in shades of blue are proficient. Light blue represents “On Track” and dark blue represents “Mastered”. The percentages to the left of the line in shade of red are not proficient. Light red represents “Approaching” and dark red represents “Below”.
TN Ready 3rd Grade Proficiency Data (by Bright Start TN Region)
Statewide average: 35.7% of Tennessee 3rd graders are proficient in ELA (2022). 36.4% of Tennessee 3rd graders are proficient in math (2022).
TN Ready 3rd Grade Proficiency Data (by school district)
Some rounding may cause data not to total to 100% across a bar chart. This is directly from the source data.
Any data not displayed in the table is not available from the source
*Indicators
- Ultimate Indicators – The % of 3rd grade children proficient in reading and math are the highest indicators for the Bright Start Tennessee Network.
- Major Indicators – Each of the 15 measures of success have a major indicator associated with them.
- Proxy Indicators – In some cases where a major indicator is not available for a measure of success, a proxy indicator has been found as a substitute.
- Secondary Indicator – In some cases, a secondary indicator has been provided below the major indicator to support the measure of success.
Got questions? See something that needs to be updated? Let us know! We can be reached at data@tqee.org


